Every Yuneta release is measured before it is tagged, and every release ships a performance report. This page keeps the history: the trend of the main figures, release after release, and a link to the report of each release.
Two kinds of figures are kept:
A/B figures. The same benchmark, built with the module of the new release and with the module of the release before, the two binaries run alternately on one machine. They say what the release changed. A change inside the spread of its rounds is noise, and it is called noise.
Absolute figures. The benchmarks run on the build of the release at tag time. They say what one machine does with the release: records stored per second, messages per second, what one operation costs.
A figure that got slower is never left out. It is shown with its reason, as the CHANGELOG states it: most are the price of a guarantee (a file that survives a power cut, a record that reaches the disk before a command runs), kept by decision.
Reports
| Release | Against | Report | Rendered | Raw figures |
|---|---|---|---|---|
| 7.25.5 | 7.25.4 | 7.25.5.html | view | 7.25.5.json |
The report is one self-contained page (no script, no external file). GitHub
shows it as source code; the “view” link renders it. How a report is made, and
the schema of its .json, are in
performance/reports/README.md.
The trend
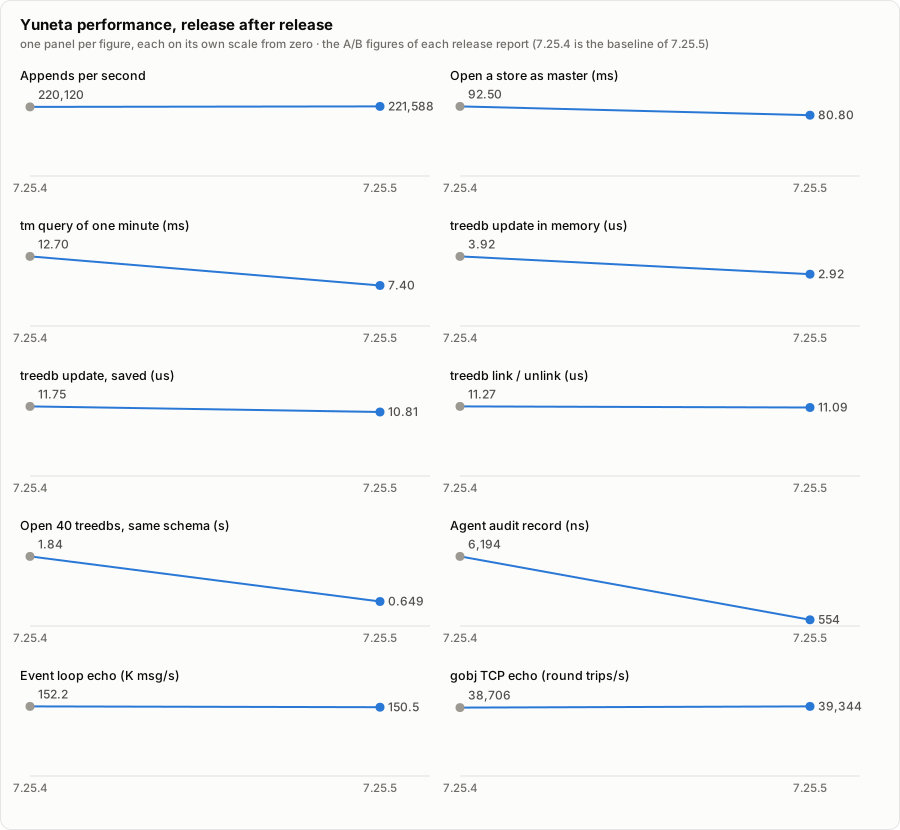
The main A/B figures, one panel each, on their own scale from zero. The first report (7.25.5) gives two points: 7.25.4, its baseline, and 7.25.5. Each new report adds one point.
The C_TREEDB open compares two separate runs: 7.25.4 (medians of an earlier run) and 7.25.5 as shipped (the tag-time run). Every other point of the table comes from one alternated A/B run.
| Figure | Unit | 7.25.4 | 7.25.5 |
|---|---|---|---|
Appends per second (test_topic_pkey_integer, 4 link layouts) | appends/s | 220,120 | 221,588 |
Open a store as master, 20 000 md2 files (perf_timeranger2) | ms | 92.5 | 80.8 |
| A tm query of one minute of a key | ms | 12.7 | 7.4 (migrated) |
treedb: update a node in memory (perf_tr_treedb) | us | 3.92 | 2.92 |
| treedb: update a node and save it | us | 11.75 | 10.81 |
| treedb: link or unlink two nodes | us | 11.27 | 11.09 |
C_TREEDB: open 40 treedbs whose schema did not change (perf_c_treedb) | s | 1.84 | 0.649 |
One agent audit record of 300 bytes (perf_rotatory) | ns | 6,194 | 554 |
Event loop echo, 1 KB messages (perf_yev_ping_pong) | K msg/s | 152.2 | 150.5 |
TCP echo through the gobj stack (perf_tcp_test4) | round trips/s | 38,706 | 39,344 |
What each figure means
| Figure | What it tells a user |
|---|---|
| Appends per second | How many records one yuno stores per second in a key-indexed timeranger2 topic. It is the write rate of every history, queue and log that Yuneta keeps on disk. |
| Open of a store | The start-up time of a yuno that owns a store (master) or follows one that another yuno writes (replica). |
| tm query | A read of a time range of a key: what a dashboard or a report pays to load one minute of data. |
| treedb update, link, create, delete | The cost of one change in the graph database: a node changed in memory, a node changed and saved, a relation made or undone, a node created or removed. The CPU time of the process, per operation. |
| C_TREEDB open | The start-up of a yuno with many treedbs. With an unchanged schema it is the everyday case; the first open (seed) and the open with a newer schema are one-time costs. |
| Agent audit record | What every command sent to the agent pays to be audited. |
| Log record | What a yuno pays for one line of its log file. |
| Event loop echo | The ceiling of the io_uring event loop alone: 1 KB messages echoed per second, no gobj layer. |
| gobj TCP and TLS echo | Round trips of a JSON message through the whole stack (C_IOGATE, C_TCP_S, C_PROT_TCP4H, C_CHANNEL), plain and encrypted, with and without a timeranger2 append per message. |
| Publish | gobj_publish_event(): one event delivered to N subscribers of one gobj, the in-process message bus. |
| Binary size | Each yuno is one fully static executable. The size includes OpenSSL and the whole framework. |
7.25.5 against 7.25.4
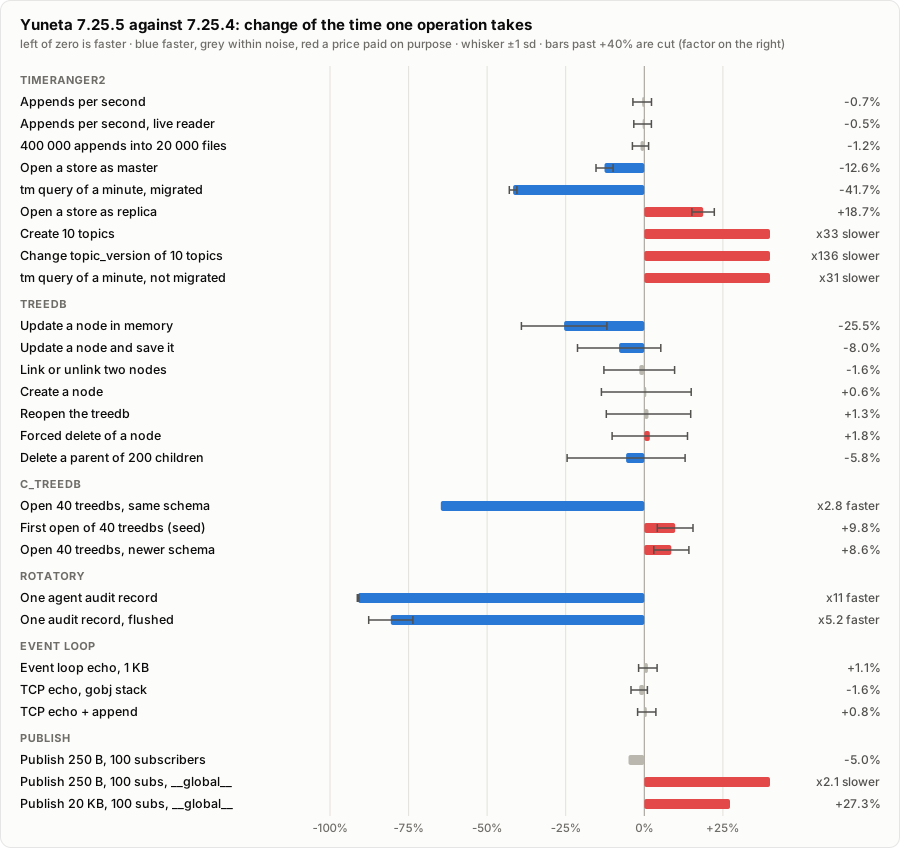
One bar per figure: the change of the time one operation takes (a rate is turned into time per operation), left of zero is faster. Blue is faster, grey is within the noise of its rounds, red is slower and kept by decision.
The prices of 7.25.5, and what each one buys:
| Slower | By | Why |
|---|---|---|
| Create a topic (timeranger2) | 3.6 -> 118.9 ms for 10 | 2 fsyncs per topic: a power cut never leaves a topic whose files are not on disk. |
Change a topic_version | 1.7 -> 231.5 ms for 10 | 4 fsyncs per change: never a new topic_version over a topic_cols.json that is not on disk. |
| A tm query on a topic of 7.25.4 or earlier | 12.7 -> 391.6 ms | Until mark-tm-order migrates the topic (19 ms, once): the old topic does not say that its tm order holds. After the migration the query takes 7.4 ms. |
| Open a store as a replica | 89.7 -> 106.5 ms | One more stat() per md2 file: a replica looks for the order markers after reading each file, so it cannot miss one the master writes during the open. |
| C_TREEDB: first open, newer schema | +10%, +9% | The record of the projection in progress, written whole with its fsyncs: a crash in the middle is finished at the next open. |
Publish with __global__ or __local__ | +0.23 us a delivery | Each such subscription gets its own kw_twin() of the event, so a peer’s subscription cannot change the event of every later subscriber. Every remote (C_IEVENT_SRV) subscription carries __global__. |
| treedb forced delete | +1.8% (~1 us) | The delete holds its events and keeps the column that lets a refused delete change nothing. |
| The agent audit record, built | +2-3% | Names are judged with their JSON escapes decoded, and a write-attr is looked for in every string: no secret reaches the audit file. |
Every A/B of 7.25.5, change by change, with its rounds and spread, is in
performance/c/README.md
and in the CHANGELOG (“Performance, against 7.25.4”).
What one machine does with 7.25.5
Measured at tag time on the build of 7.25.5: 5 rounds (3 for perf_c_treedb
and perf_auth_bff), mean of the rounds. One process; the event loop runs on
one core, and Yuneta scales by running one yuno per core.
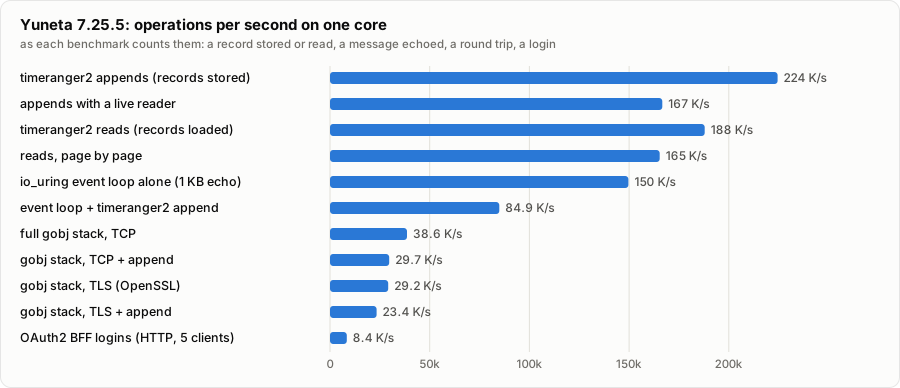
Operations per second on one core, as each benchmark counts them: a record stored or read, a message echoed, a round trip, a login.
| Figure | Benchmark | 7.25.5 |
|---|---|---|
| Records stored per second, one key-indexed topic | test_topic_pkey_integer | 224,455 +- 2,585 |
| The same, with a live reader (an rt list) | test_topic_pkey_integer | 166,654 +- 1,748 |
| Records stored per second, one key, 600 000 appends | perf_timeranger2 tm_build_appends | 365,459 +- 5,836 |
| Records read per second, every record of 2 keys, one callback each | test_topic_pkey_integer_iterator2 | 187,914 +- 3,379 |
| Records read per second, page by page | test_topic_pkey_integer_iterator5 | 165,301 +- 1,971 |
| Open a store as master, 20 000 md2 files | perf_timeranger2 | 79.8 ms |
| A tm query of one minute of a key (migrated topic) | perf_timeranger2 | 7.2 ms |
| treedb: update a node in memory / saved | perf_tr_treedb | 2.76 us / 10.37 us |
| treedb: link or unlink / create / forced delete | perf_tr_treedb | 11.02 us / 71.0 us / 69.2 us |
| C_TREEDB: open 40 treedbs, schema unchanged | perf_c_treedb | 0.649 s |
| One log line of 300 bytes | perf_rotatory | 381 ns |
| One agent audit record / flushed | perf_rotatory | 570 ns / 1,263 ns |
| Event loop echo, 1 KB messages / with an append | perf_yev_ping_pong, perf_yev_ping_pong2 | 149.6 K / 84.9 K msg/s |
| gobj stack, TCP round trips / with an append | perf_tcp_test4, perf_tcp_test5 | 38,587 / 29,699 per s |
| gobj stack, TLS (OpenSSL 3.6.3) round trips / with an append | perf_tcps_test4, perf_tcps_test5 | 29,166 / 23,363 per s |
| OAuth2 BFF logins (HTTP, 5 clients, mock IdP) | perf_auth_bff | 8,446 per s |
| Binary size of a yuno, fully static with OpenSSL | outputs/yunos/* | 10.1-10.4 MB stripped, 33.9-34.7 MB with debug information |
TLS with OpenSSL costs 24% of the round trips of plain TCP through the gobj stack (29,166 against 38,587). mbedTLS is not built on the measuring machine, so its figures are not in the report.
How the figures are measured
The machine. One laptop, the same for every report until a report says otherwise: an Acer Nitro AN517-53 with an 11th Gen Intel Core i7-11370H (4 cores, 8 threads, up to 4.8 GHz), 31 GiB of RAM, a Samsung 990 PRO NVMe with ext4, Linux 7.0.0-34-generic, Ubuntu 26.04.1 LTS, glibc 2.43, gcc 15.2.0. Absolute figures compare only between reports of the same machine.
The build. RelWithDebInfo (
-O2 -g), gcc, fully static, OpenSSL, withCONFIG_DEBUG_TRACK_MEMORYon (every allocation is tracked).A/B. The module of the old release is compiled with the headers of the new one and linked before the same libraries; the two binaries run alternately, with a
syncand a pause before each run. For timeranger2 the modules are padded to one size and linked four times at four addresses, because the address of the libraries alone moves an append by up to 2.5%.Tag time. The benchmarks of
performance/c/, in rounds, on the build of the release.
The benchmarks themselves are described in Benchmarks & Stress Tests.